Buy the dip…dollar cost average…crypto is in a supercycle that no one can stop! Well, the music has seemingly stopped since all-time highs earlier in May that have since cratered in the subsequent two weeks. Public markets remain uneasy as talks of inflation received real data to back the worry. Meanwhile in private VC markets buying the dip, buying the peak, and just plain buying all the time has been the trend across every stage.
DataStax, the commercial entity supporting the open-source project Apache Cassandra announced a quiet fundraise earlier this month by Goldman Sachs. While many firms are announcing mega funding rounds to garner press, DataStax has made a lot of moves in the last 24 months that have been relatively quiet including bringing on former Apigee CEO Chet Kapoor to take over from CEO Billy Bosworth as well as acquiring Kesque and K8ssandra to broaden their product ecosystem. A new partnership with NetApp may bring more customers that lacked familiarity with the Cassandra project ecosystem into the fold as well.
This week, we’ll take a closer look at how the individual components of the COSS Index have contributed to underperformance and what that means from a historical perspective. As part of this historical review, we uncover the 3x Cloud Premium (more below!).

Click the pink button…plz.
Private Markets
DataStax, the COSS company behind the Apache Cassandra project, announced their first fund raise in nearly 7 years with $50M from Goldman Sachs.
Styra, the company behind OPA (open policy agent), announced their $40M Series B led by Battery.
Esper, a company focused on delivering DevOps tools focused on Android devices, founded by some of the same team behind an early COSS Android company Cyanogen, announced their $30M Series B led by Scale VP.
Cyral, an open-source-centric cloud data governance and security startup, announced their $26M Series B with participation by Costanoa, Redpoint, A.Capital and a strategic investment from Silicon Valley CISO Investments.
Coiled, the company behind Dask (a parallel Python ML computing library), announced their $21M Series A led by BVP.
Superconductive, the company behind Great Expectations (a leading data quality tool), announced their $21M Series A led by Index.
Public Markets
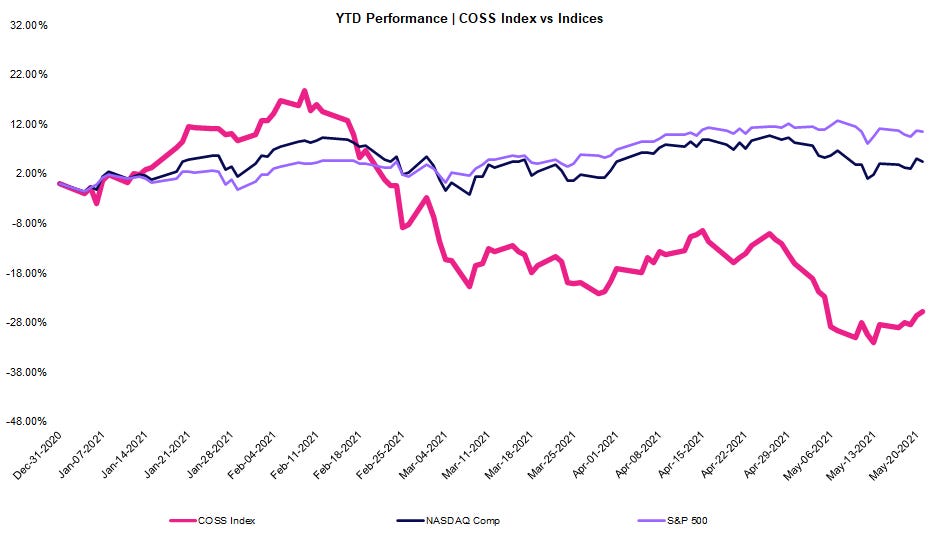
To track the performance of COSS companies, we’ve created an equal-weighted index comprised of public names including: MongoDB, Elastic, Talend, Cloudera, Rapid7, Fastly and Jfrog. In this week’s edition and going forward, we’ll use the YTD performance to keep our reference point fixed.
As shown below, the COSS Index has significantly underperformed the broader markets after a quick start to the year.
COSS Index -26%
NASDAQ +5%
S&P 500 +11%
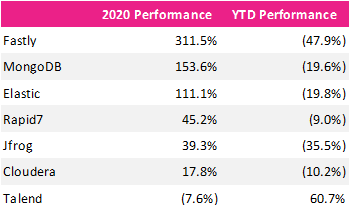
Parsing the individual components of the COSS Index illustrates how each stock has fared with most down double digits (excluding Talend who announced their intent to be acquired by Thoma Bravo) and every company trading below the NASDAQ. 2021 underperformance has also sharply contrasted with 2020 outperformance in which every company (excluding Talend) was up double-digits and three were up triple-digits. Below, we’ll take a look at what this means from a valuation standpoint as it relates to the long arc of history.
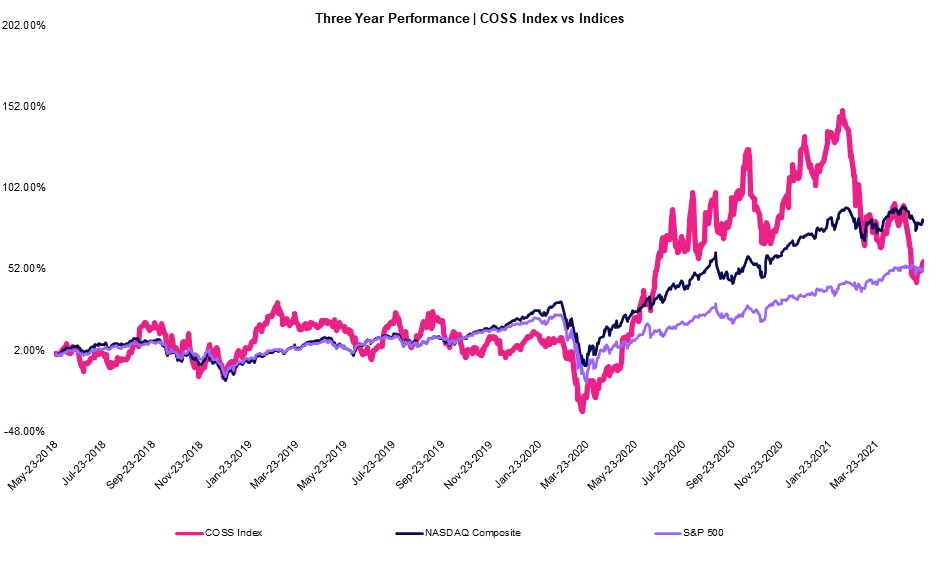
The two-week decline sent the three year performance below the benchmarks as well:
COSS Index +57%
NASDAQ +81%
S&P 500 +52%
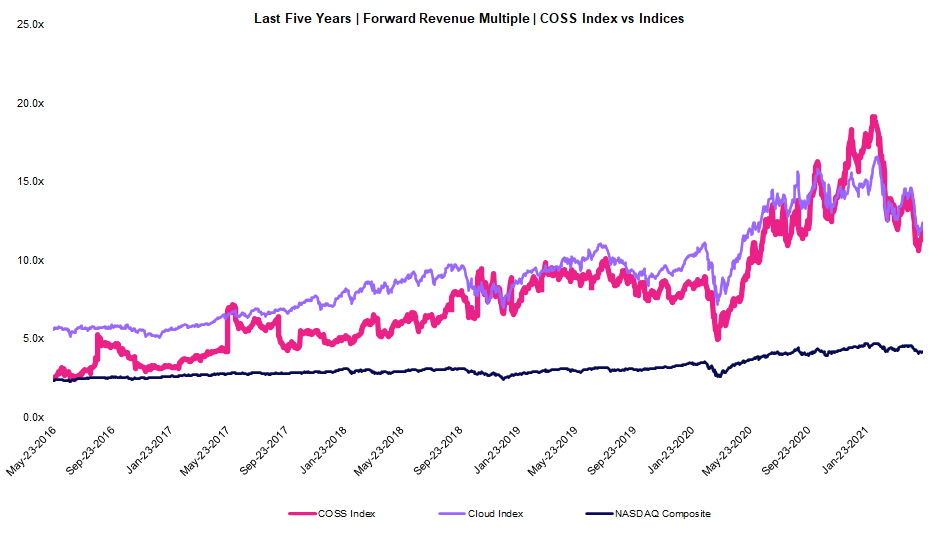
COSS companies traded up over the last two weeks but continue to underperform their Emerging Cloud peers continuing a trend we’ve seen for ten weeks running. All three indices continue to trade significantly higher than their five-year average.
COSS Index: Current Multiple 11.9x | Five-Year Mean: 7.7x
Emerging Cloud Index: Current Multiple 12.4x | Five-Year Mean: 9.1x
NASDAQ Composite: Current Multiple 4.2x | Five-Year Mean: 3.1x
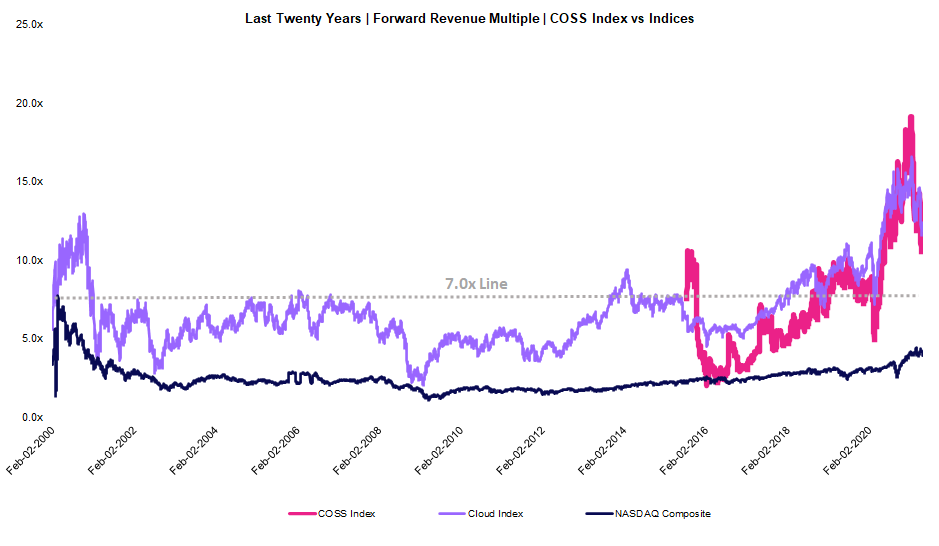
Taking a longer period window provides more context around premium valuations in the market. Over the last 20 years, cloud companies (and OSS companies as a proxy) have traded around ~7.0x average forward revenue while the NASDAQ has traded around ~2.5x. Across both indices, the current premium is high (80% for cloud companies and 68% for the NASDAQ Composite). Although the buildup took several years to sustain valuations above 7.0x, the move downward is usually more violent (e.g. 2001, 2008). It appears that valuations have begun to correct toward their historical norms, but it remains to be seen how long this movement will persist. Unlike in previous drawdowns (internet bubble, housing crisis), there hasn’t been a catalyst to accelerate losses which has made prognosticating harder.
The 3x Cloud Premium
Another interesting long-term trend is the Emerging Cloud premium to the NASDAQ. Over the last 20 years, Emerging Cloud companies have traded ~3x higher than the NASDAQ Composite. Even with elevated valuations, this premium continues to hold with Emerging Cloud companies trading at 12.4x vs the NASDAQ at 4.2x (in the chart above, the past 5-year average corroborates with Emerging Cloud companies trading at 9.1x vs the NASDAQ at 3.1x). In general, investors have been willing to pay three times as much for a dollar of emerging cloud revenue relative to non-cloud revenue. A big part of this premium is based on growth…a trend we will explore next time!
Emerging Cloud Index: Current Multiple 12.4x | Twenty-Year Mean: 6.8x
NASDAQ Composite: Current Multiple 4.2x | Five-Year Mean: 2.5x
Not financial advice.